BI output
waveBI outputs business intelligence information in 4 primary ways:
- Report format: both existing tried-and-tested reports and bespoke reports created specifically to match clients needs. Reports can be viewed directly online in grid format or can be downloaded for retention by the client in .doc or .csv formats
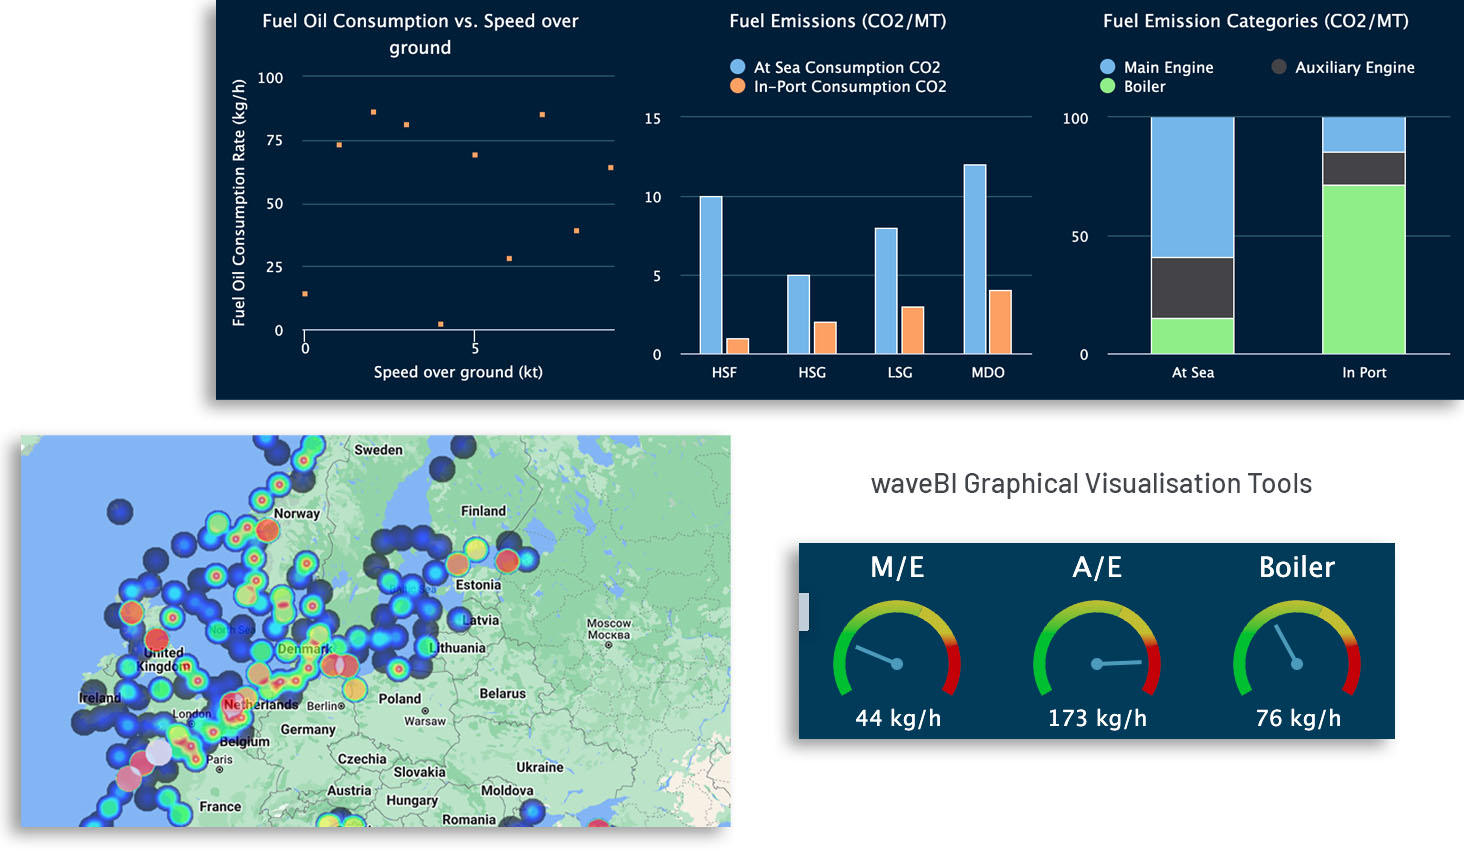
- Graphical visualisation tools: these are too many to list but typically include many varieties of chart, traffic lights, league tables, heat maps, etc.
- iFrame embedding: BI from waveBI is embedded in the customer’s online platform via HTML, allowing the output to appear to end users as if it originated from the client’s own in-house service
- API back to client system: some or all waveBI output can be sent back to clients’ in-house systems in this way if required