The Benefits
The fundamental flexibility of the waveBI BigData environment makes it suitable for virtually any maritime data analysis application. Click the links below to see some examples of how the technology can be used to help organisations become more efficient, comply with regulatory requirements or, even, generate new sources of revenue.
Shipping is under continuous pressure to become green. Regulations now mean vessels are seeking many small incremental savings for compliance and cost reduction. We are helping clients use in-house data to achieve those imperative savings and allow the supply chain to meet its green objectives. Here are 3 ways in which waveBI can be utilised to provide owner/operator advantages in their business activities:
Route Optimisation
The savings start with voyage planning and fully optimised routes. Data from multiple sources are combined to generate routes that are firstly safe, then efficient, work with mother nature and now comply with carbon intensity regulations.
‘Clean is Green’
Clean ships are essential to efficiency, therefore choosing the right coating and predicting when to clean the hull is essential; missing that optimum window is now just too expensive. waveBI is being used to predict when vessels are going to foul, based on the operational and geographic nature of the vessel, to keep them moving efficiently.
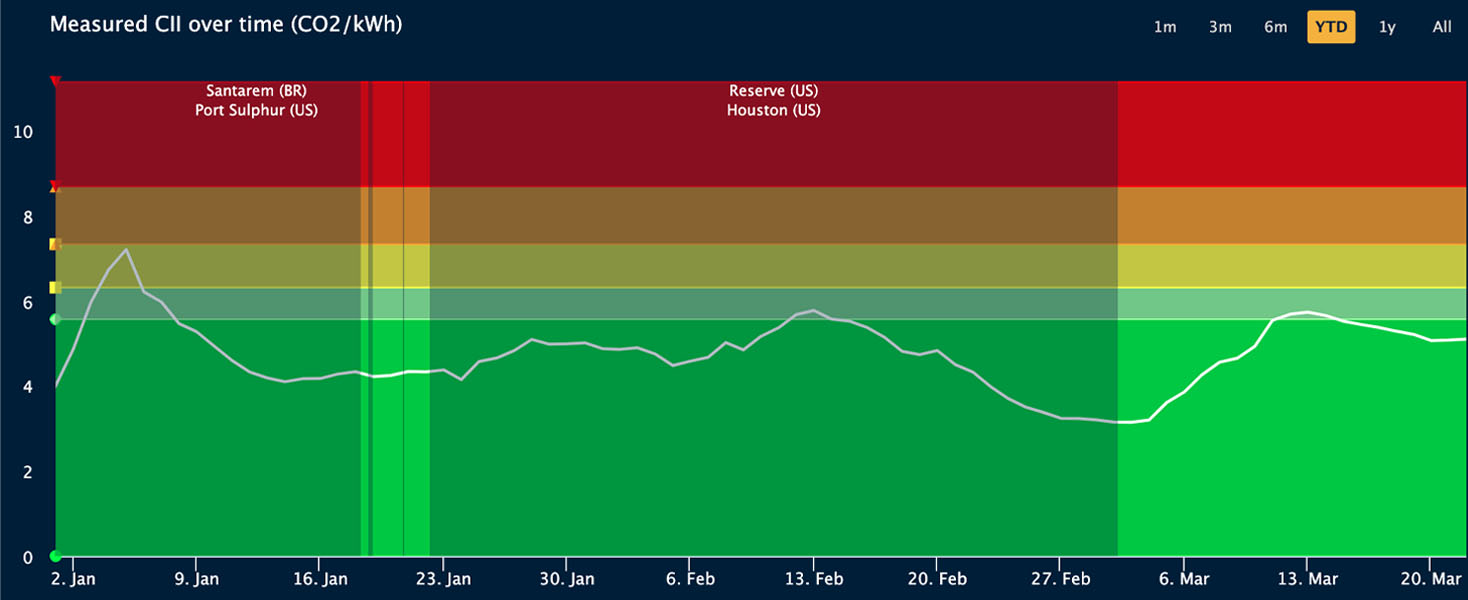
Carbon Intensity Indicators
CII is quantified simply by carbon output/ton/mile. When real-time sensor data from vessels is combined with waveBI’s tracking, routing and environmental data then it is possible to measure carbon intensity in real-time. This enables owners and managers to ensure their ‘green credentials’ remain intact and the vessel is operating within the regulated efficiency band.
Insurers and brokers the world over are data-driven decision makers. waveBI is used to manage financial exposure for underwriters in real-time and to evaluate risk profile based on historic data.
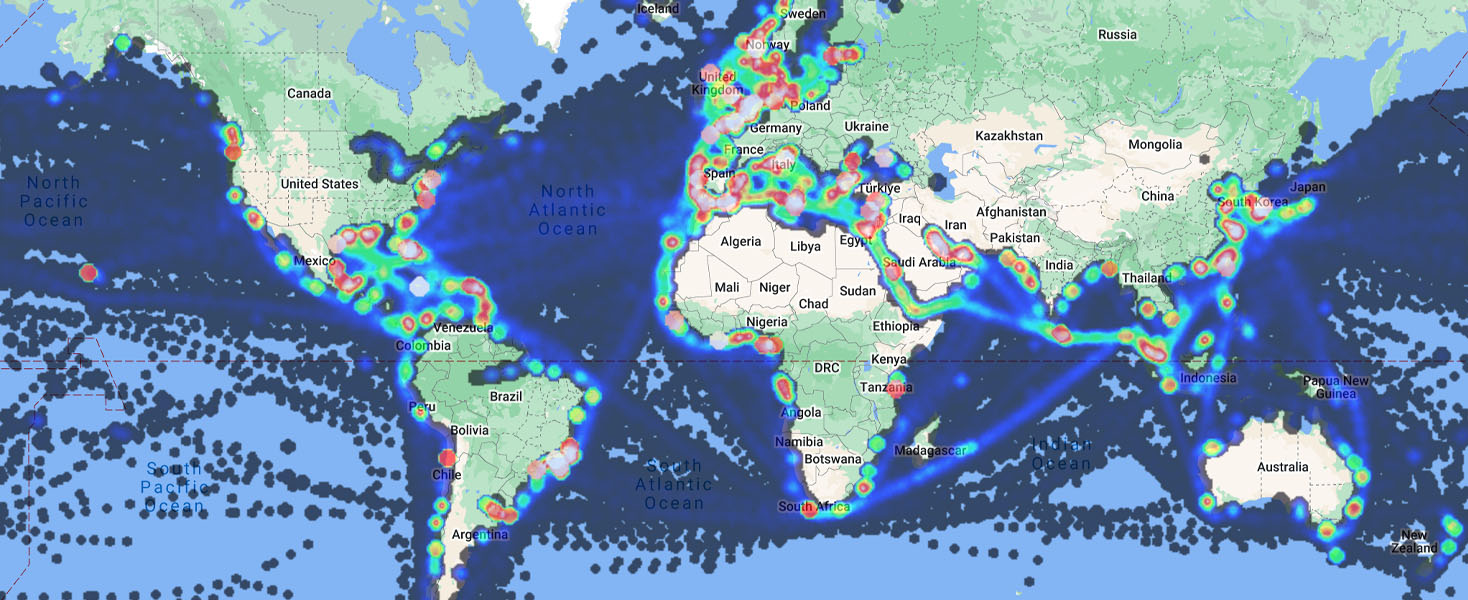
Financial exposure is the amount an insurer may have to pay out at any one time should the worst happen at sea. When 100’s of ships continuously move in and out of harms way, due to named weather events or higher security risks, that total exposure is constantly changing, we provide that service to the maritime insurance industry.
Such services enable vessel operators and insurers to identify when risk increases and to make premium changes. In addition to premium changes, this enables insurers to offset that exposure via reinsurance when the financial exposure is too high.
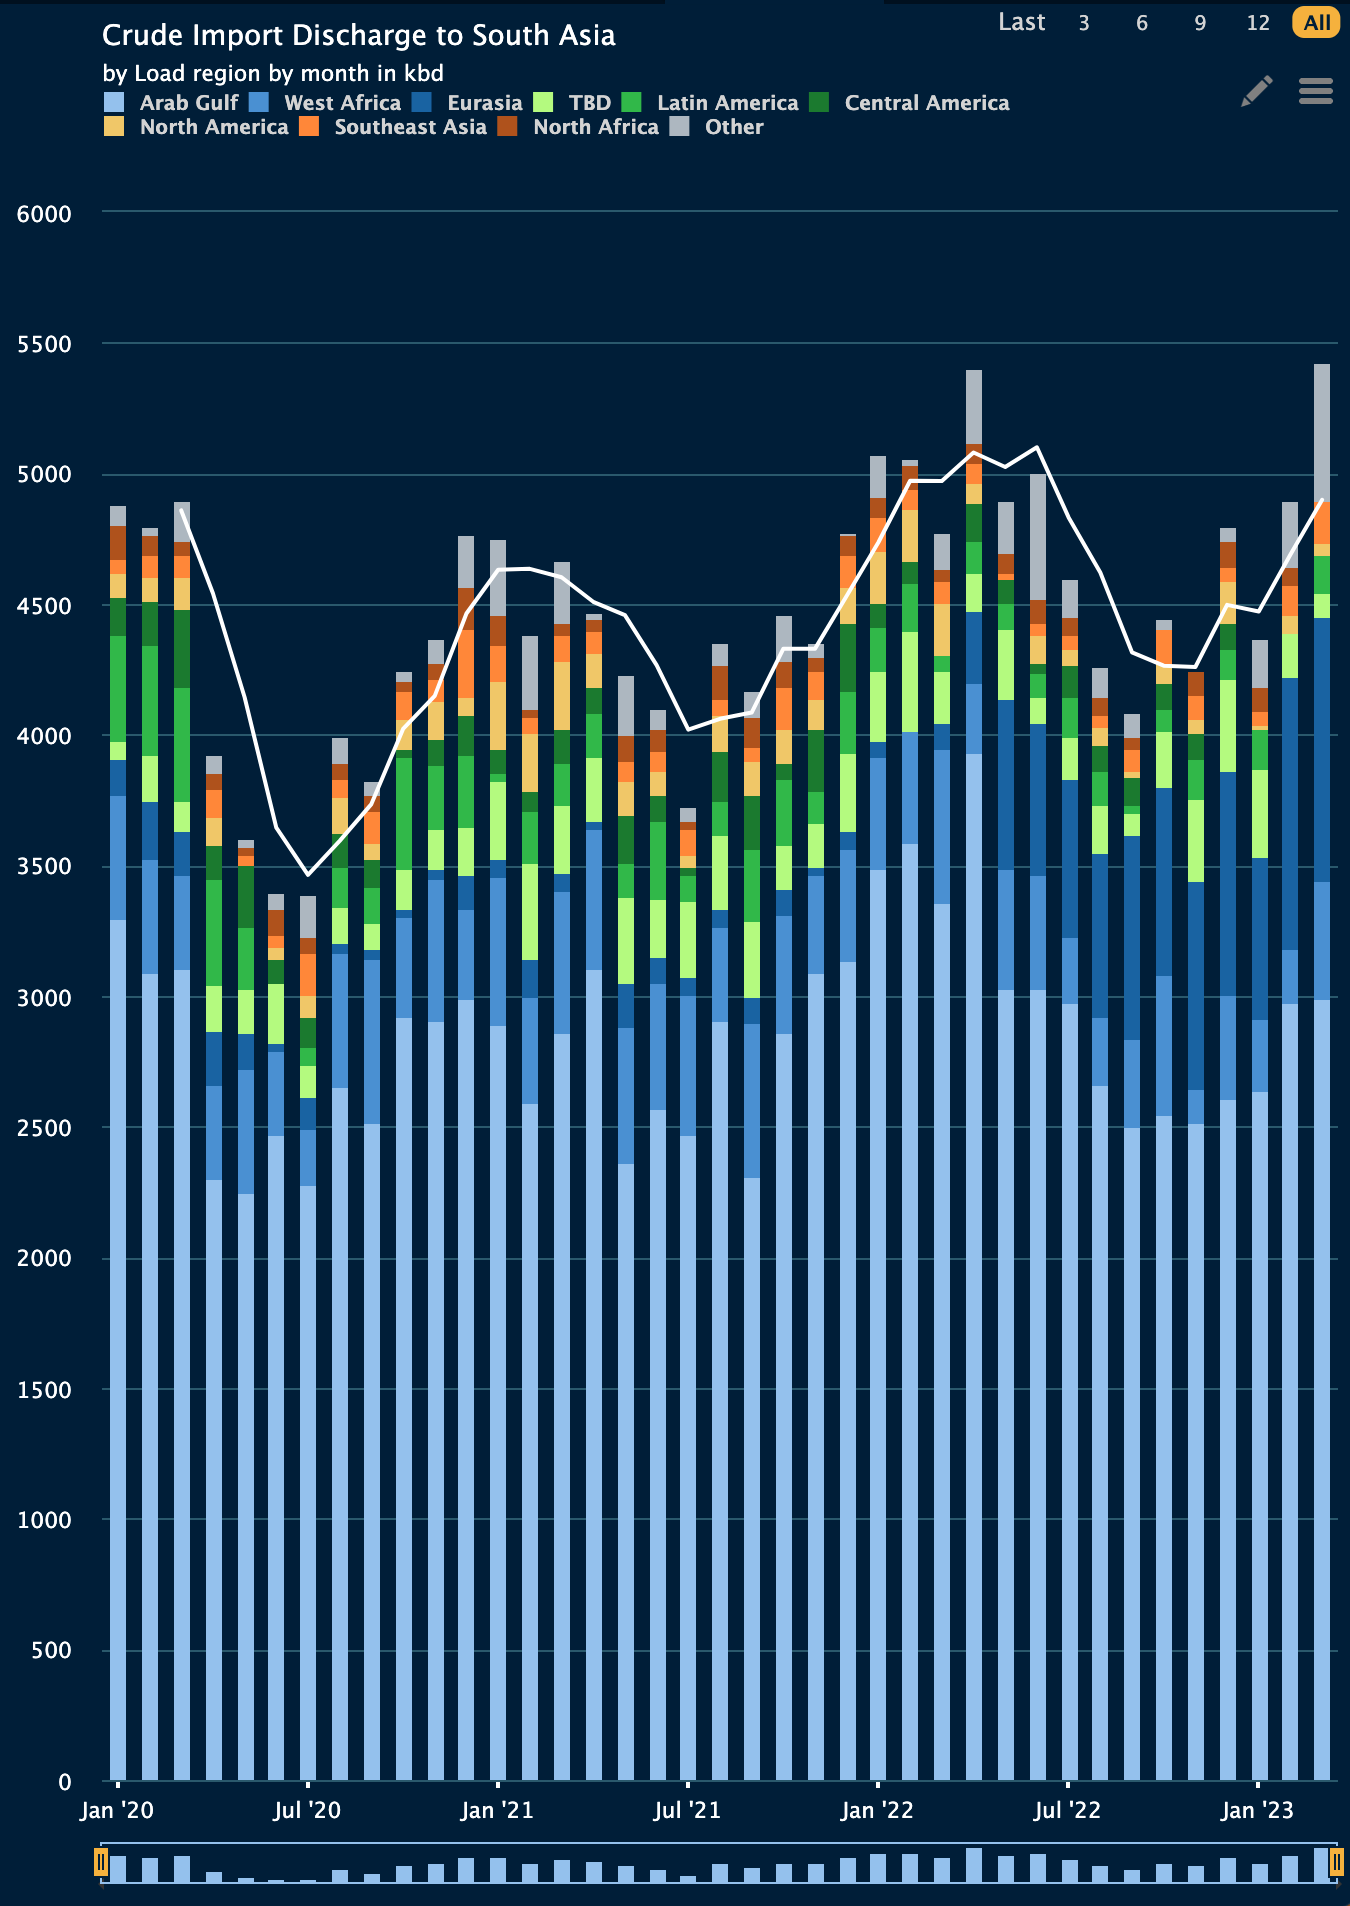
When combination of cargo data and carrier vessel movement is scaled up globally, this provides commodity traders the real time macro-economic picture. Knowing exactly what is on the sea globally, destination and ETA provides traders a forecast tool of short or excess supply and when.
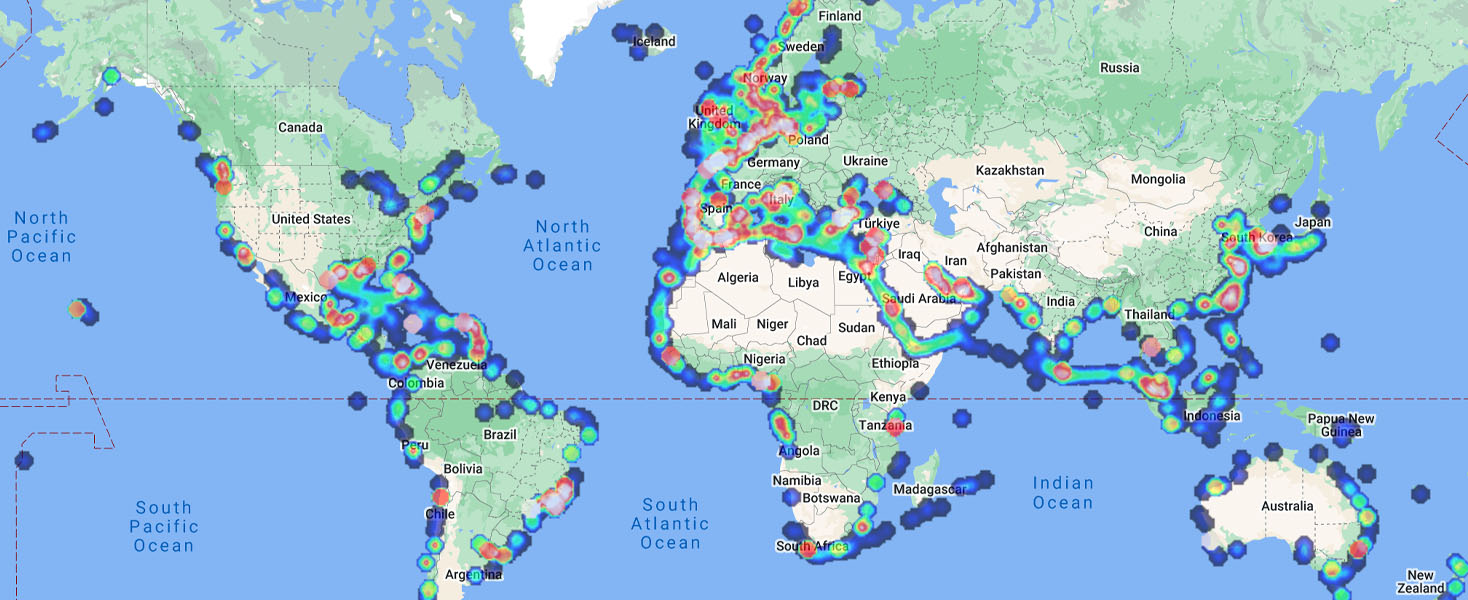
When historic shipping data is combined with historic cargo movements, it is possible to demonstrate how supply and demand has impacted historic market rates and price cycles for the last 10 years. These global trends and balance of trade figures are of particular interest to financial institutions.